Table of contents
What is Grafana?
Grafana is an open-source data visualization and monitoring tool. It is designed to help users understand and analyze their metrics, logs, and other data through customizable dashboards and intuitive graphical representations.
With Grafana, you can connect to various data sources such as databases, cloud platforms, and monitoring systems, allowing you to pull in real-time and historical data. It supports popular databases like MySQL, PostgreSQL, and Prometheus, as well as cloud platforms like Amazon Web Services (AWS) and Microsoft Azure.
One of Grafana's key features is its ability to create interactive and dynamic dashboards. Users can build visually appealing dashboards by dragging and dropping various panels, which can include graphs, charts, tables, and other visual elements. These panels can be configured to display metrics, logs, or any other data you wish to monitor or analyze.
Grafana also provides extensive customization options, allowing users to fine-tune the appearance and behavior of their dashboards. You can set up alerts and notifications based on specified thresholds, so you are promptly notified when certain metrics exceed or fall below predefined values.
Furthermore, Grafana supports collaboration, allowing users to share their dashboards and collaborate with team members. It also provides role-based access control, enabling administrators to manage user permissions and restrict access to sensitive data.
Overall, Grafana is widely used in various domains, including software development, IT operations, DevOps, and the Internet of Things (IoT), to visualize and analyze data from different sources, making it easier to understand complex systems and make data-driven decisions.
Installation of Grafana.
Grafana can be installed on various operating systems, we are installing it on Aws ec2 t2.micro ubuntu.
To install Grfana, you can follow these general steps:
Download the Grafana GPG key, This GPG key is used to verify the authenticity of Grafana packages during installation.
  sudo apt-get install -y apt-transport-https #This command installs the apt-transport-https package, which allows the system to fetch packages securely over HTTPS.
  sudo apt-get install -y software-properties-common wget #This command installs the software-properties-common package, which provides an easy way to manage software repositories,
  sudo wget -q -O /usr/share/keyrings/grafana.key # to download the Grafana GPG key
  https://apt.grafana.com/gpg.key #saves key in this directory
Download the Grafana Stable release or Beta release based on the requirements.
  #Stable release
  echo "deb [signed-by=/usr/share/keyrings/grafana.key] https://apt.grafana.com stable main" | sudo tee -a /etc/apt/sources.list.d/grafana.list

  #Beta release
  echo "deb [signed-by=/usr/share/keyrings/grafana.key] https://apt.grafana.com beta main" | sudo tee -a /etc/apt/sources.list.d/grafana.list
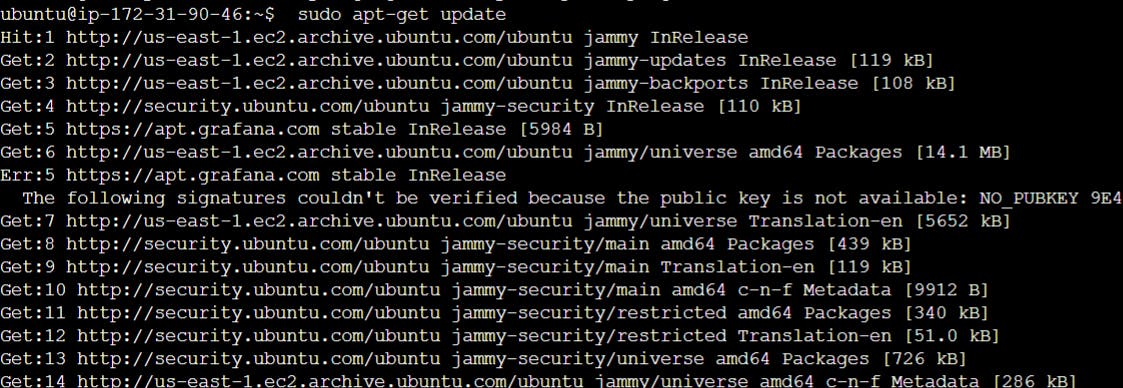
Update the list of available packages.
sudo apt-get update

Install Grafana.
sudo apt-get install grafana

Start Grafana.
sudo systemctl start grafana-server # to start grafana serviceEnable Grafana.
sudo systemctl enable grafana-server # It is Important because whenever our server will closed or restart it will automatically start grafana applicationGrafana runs on 3000 ports in order to access Grafana, we have to enable a 3000 port on the instance security group.
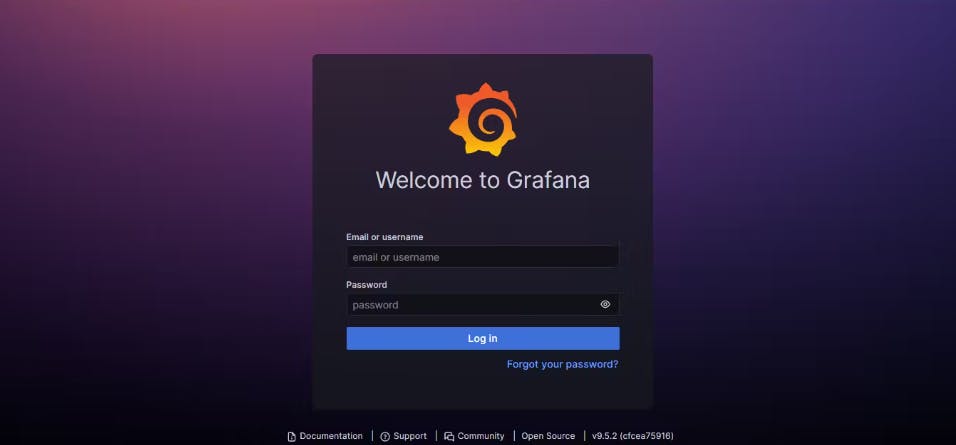
Access it by opening a web browser and entering the appropriate URL, Also for login use the default username password "admin". After that set a new password according to your choice.

Grafana Dashboard.

Thanks for Reading 😊😊
